
The Use and Benefits of Thermographic Imaging
[To Download a FREE PDF of this guide scroll to the end]
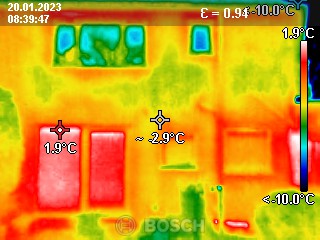

The beauty of thermography is that it is quick and non-destructive, so perfect to use in people’s homes as a first sweep across the external envelope.
Infrared Thermography
Infrared Thermographic photography is a way to visualise the heat energy on any given surface. It is essentially a heat map camera that displays temperatures as colours so you can visualise relative temperatures. If you are concerned with heat loss in buildings or locating draughts, then thermography is a helpful analysis tool.
The camera does not ‘see through’ things, but it can detect what is happening behind a surface due to the way that energy is flowing to the face of that surface. For example, a thermographic image can pick out the vertical studs in a wall or rafters in a roof construction due to the effect that these members are having on the internal surface temperature.
Technology has made these cameras (or camera attachments to smartphones) an affordable addition to the utility belt of a building surveyor or retrofit consultant. This article will explain how they can be used and illustrate some typical examples of heat loss detected using this method, alongside solutions straight out of the Detail Library catalogue.
Back to School
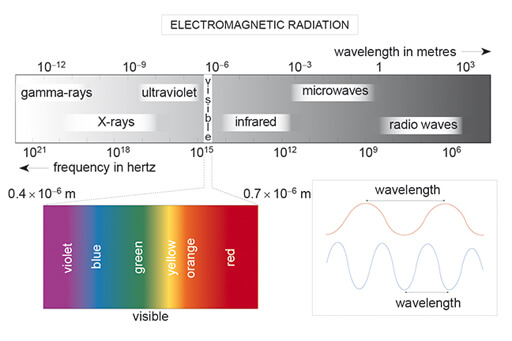
If you recall your electro-magnetic spectrum from school science, we can only see a fraction of the energy waves which we call the visible spectrum. Switching to Latin class, Infrared (or ‘further-on from red’) is the wavelength just beyond the visible spectrum at the red side of the chart. These have longer wavelengths than we can observe. Infrared (IR) is energy emitted by heated objects and has a wavelength of 800 to 1000nm. IR has a number of useful applications, from astronomy to medical applications (remember those COVID point ‘n shoot thermometers?), from your TV remote to meteorology.
Passing through the visible (red, yellow, orange, cyan, blue) at the other end is ultraviolet (‘beyond violet’) that describes the shorter wavelengths. So, IR and UV bookend the visible spectrum.
Remember: heat is just energy. All that energy wants to do is move from something hot to something cold.
Heat will move from a warm internal room to the cooler outdoors, or from your feet to the carpet. Like water finding the hole in a bucket, heat will find a poorly insulated window or a gap in the insulation layer and inexorably flow towards it. This is why in buildings, thermal continuity and airtightness are the two frontiers where we fight discomfort.
Thermal Bridges
Typically, in buildings the heat loss is exaggerated at any junctions, edges and openings. These are described as thermal bridges AKA localised areas where the heat is allowed to flow more easily from warm to cold. IR cameras are a great tool for building professionals to diagnose cold bridges in existing buildings and find solutions for homeowners or building managers.
Thermal bridges can be repeating, like a series of repetitive roof rafters, or isolated examples like a single waste pipe passing through the external wall. Other examples include window reveals or fixings that penetrate the insulation layer, like structural balcony supports. Even metal cavity ties contribute to transferring energy across the wall construction.
There are three ways that heat is transferred:
Conduction – through a solid surface like a solid stone door threshold, a stainless steel glazing spacer bar or a roof rafter that passes from inside to outside.
Convection – via a liquid or gas, so typically this describes heat loss from buildings through ventilation (controlled and uncontrolled gaps and cracks).
Radiation – via electro-magnetic waves. In buildings this relates to solar gain and the unhelpful ways that poor fabric can affect internal comfort and cause overheating.
For internal comfort and heat retention, we are generally concerned with the first two, Conduction and Convection. These capture the poor ways that buildings have been constructed (allowing heat to transfer through uninsulated materials), or air escaping through unintended gaps and openings.
IR Thermography for Diagnostics
Thermography is one of the tools for retrofit professionals to analyse an existing building’s performance. Even if the construction of the walls, floors and roofs are known, it gives added insight into the ways these elements meet and the points of weakness. IR allows us to learn from the mistakes of the past and find better solutions.
If we suspect a weakness, without the benefit of x-ray specs, we have two ways of investigating a wall, floor or roof. An intrusive survey will drill a hole, remove a patch of plasterboard or lift a floorboard to check out what lies beneath. This is not always possible or desirable and leaves a trace.
The beauty of thermography is that it is quick and non-destructive, so perfect to use in people’s homes as a first sweep across the external envelope. Sure, intrusive works may need to follow to find the correct specification for a solution, but it may prevent that hole being drilled in the first place.
It is important to note that the use of IR thermography is seasonal. The rule of thumb is a 10degC difference between internal and external conditions to get helpful data. This means that the thermal imaging season runs from around Oct to March. I’ve found in practice that the start or end of the season, internal imaging is still useful for spotting cold bridges, but the external wall analysis of larger surfaces really needs those cold external temperatures and the heating on inside.
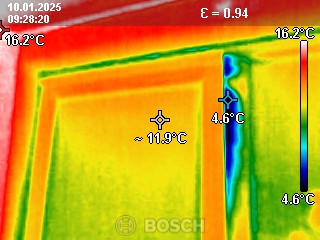
Example of cold draft at sliding door closure.
The Cameras
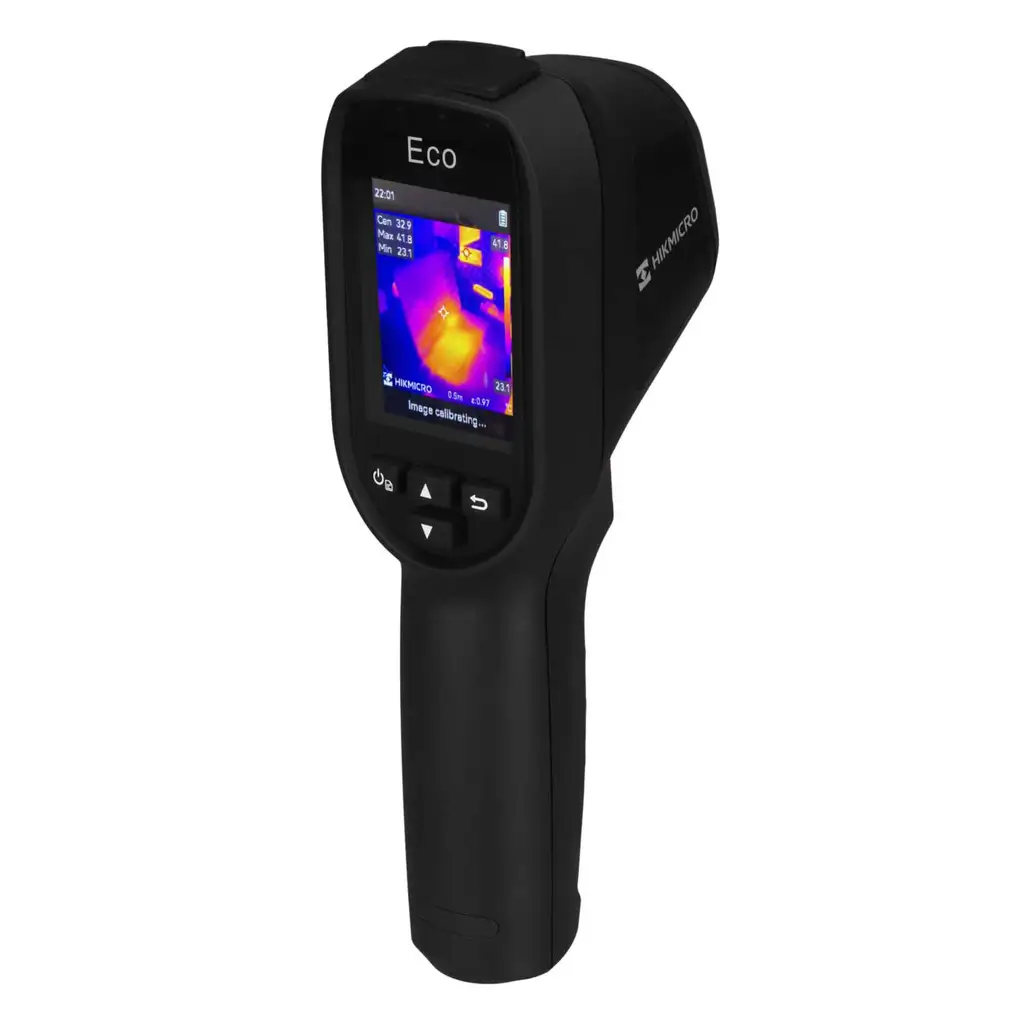
There are three types of cameras. The first is a clip-on attachment to a smartphone (c. £200), making it the most transportable type of device. The second is a ‘non-professional’ handheld device (£200-400) that tends to have a slightly larger screen and better resolution over the smartphone version. The third version is a professional camera, costing c.£1000 with higher resolution, more features and settings.
Most of these also come with supporting software for analysis. This allows temperature points to be added to an image afterwards to understand relative surface temperatures. Still images and videos can be taken, so consider how you want to use the outputs and illustrate these to your intended audience. Find the right camera that suits your budget and the outcomes you are looking for.
Understanding the Images
Hot things like people or warm surfaces appear as a bright white/yellow and cold things appear dark as blue/black. Camera sensitivity can provide read outs for temperatures ranges which are particularly useful for avoiding low surface temperatures that give rise to condensation and mould. More complex cameras also allow the colour and ranges to be adjusted for specific analysis.
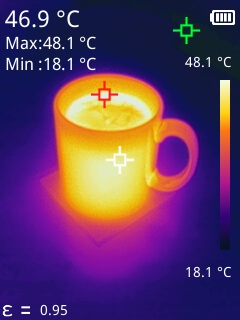
Coffee at 46.9degC – just the way I like it.
One of the main benefits of thermographic imaging for homeowners is the way it can form part of an interactive home assessment. For people who have lived in their homes for many years, they know exactly which are the colder rooms, which walls get an annual spot of damp or the draughtiest windows. The ability to show that to them is really powerful, and may mean the difference between knowing there a problem and actively seeking a solution. Therefore, it can be a way of confirming what they already knew, or suspected.
I’ve found people really enjoying seeing their home in a new light, and it forms a very interactive part of any home visit.
IR cameras can help you be ‘house detective’ spotting the shadows of old windows or walls, former questionable DIY attempts or poor workmanship. More than once I have scanned across a newly insulated sloped roof only to find at least one zone between rafters is completely unfilled. The homeowner now has the evidence to get the contractor back to rectify their mistake.
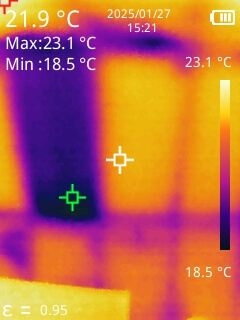
Mind the gap – a zone between two rafters missing insulation.
Even a highly performing component like a triple glazed window can leak heat and air around the edges if poorly installed. The designer has the ability to influence the component specification and the workmanship clauses, matched to a comprehensive set of details illustrating both the thermal continuity and airtightness layers.
Like any device, sensor or detector, an IR camera is a tool that requires some knowledge to use and interpret. It is one thing to see a thermal bridge but another to understand why it occurs and how to fix it. Spotting the lack of cavity closers before windows are removed means it won’t come as a shock or a late extra for the client to pay for.
Using a number of examples from my time as a retrofit professional, let’s explore some common scenarios and compare to the best practice examples found within the Detail Library.
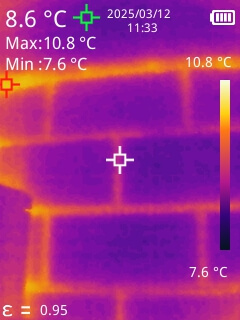
1. Poorly insulated cavity wall construction
On the left, an uninsulated cavity wall with higher heat transfer occurring through the mortar joints and along the head of the wall where it meets an intermediate floor.
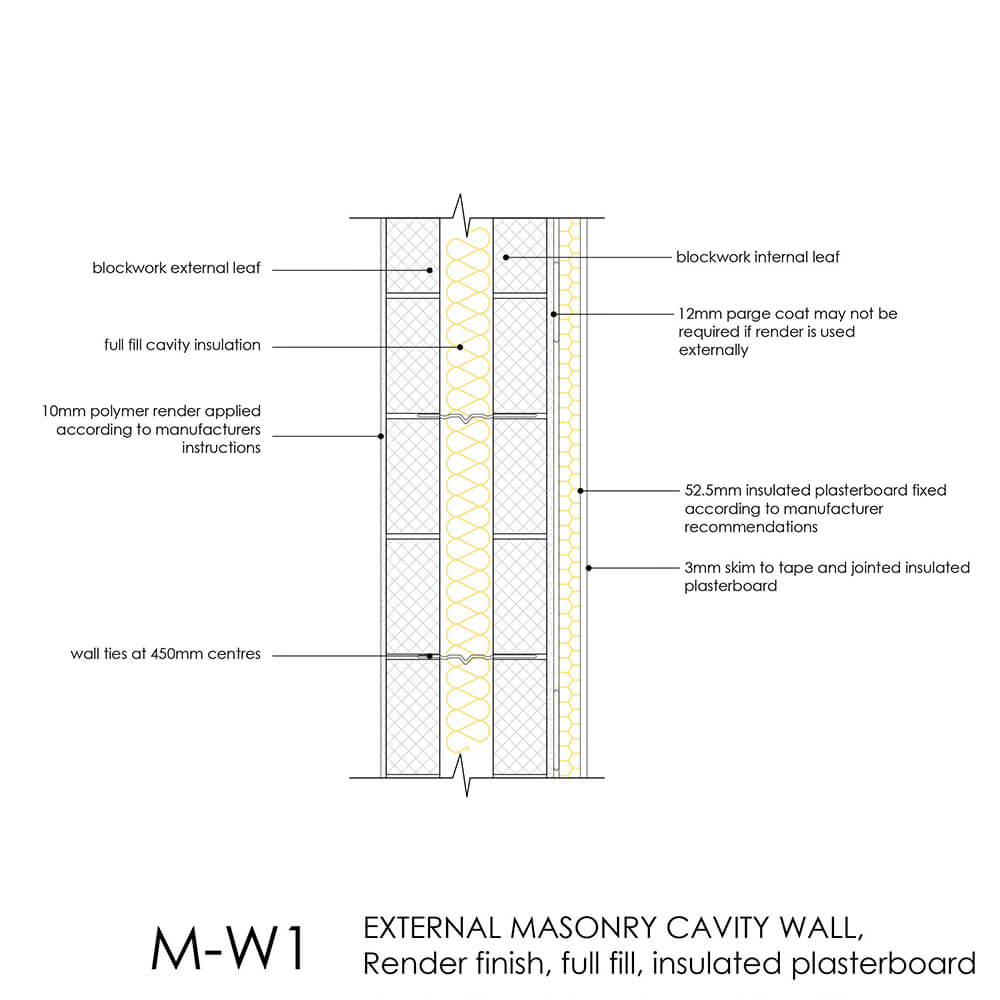
On the right, M-W1 illustrates a well-insulated cavity wall with insulation wrapping the entire inner leaf inside a warm jacket. Here, an additional layer of EWI takes the wall’s performance from good to excellent.
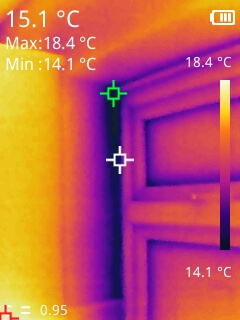
2. Heat loss around windows lacking a cavity closer
On the left, blue heat loss edges around not just the glazing edges but also the window, with the worst cold bridge up the jambs, likely due to no cavity closers and the forward placement of the window in the cavity wall.
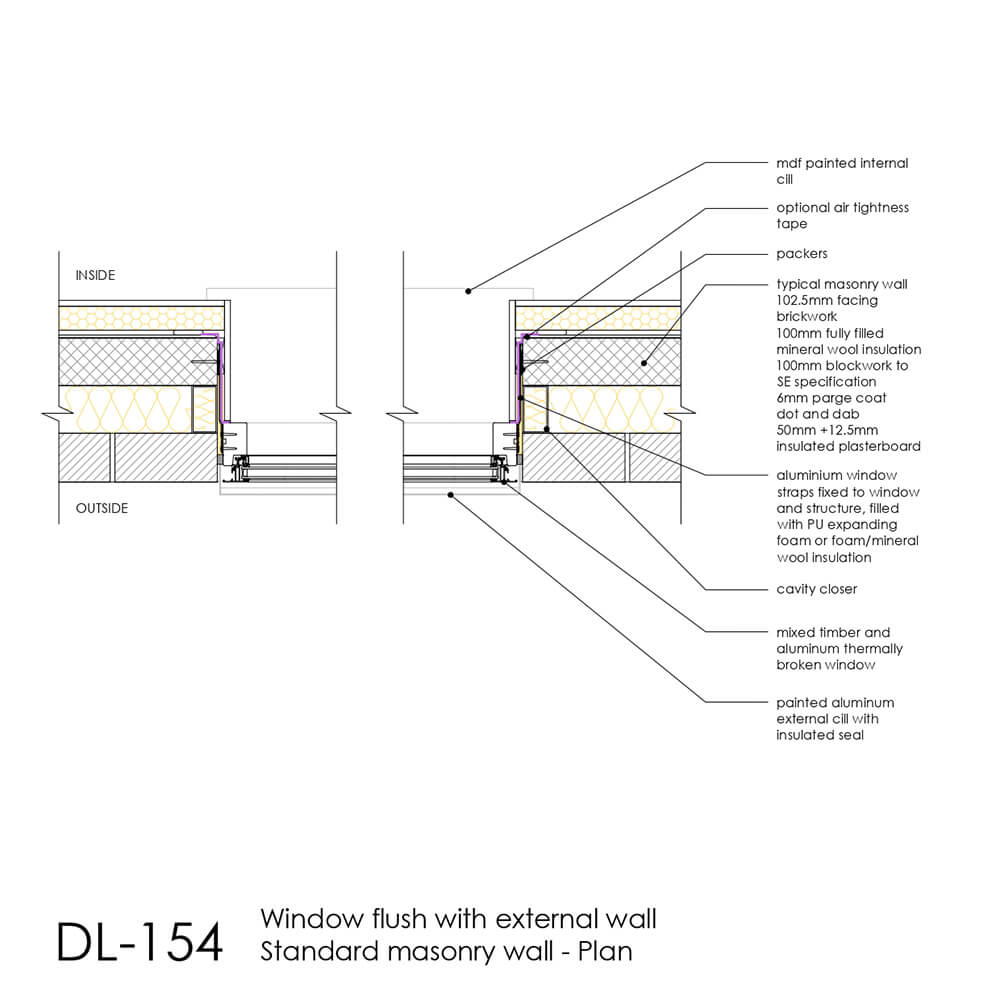
On the right, DL-154 shows even with a forward placement, cavity closers help achieve a better installation and airtightness.
3. A solid door threshold spanning inside to outside
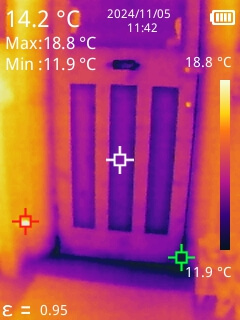
On the left, a solid threshold conducts heat from inside to outside. Also note the thin door panels and heat loss around the door edges and through the letterbox with a brush flap.
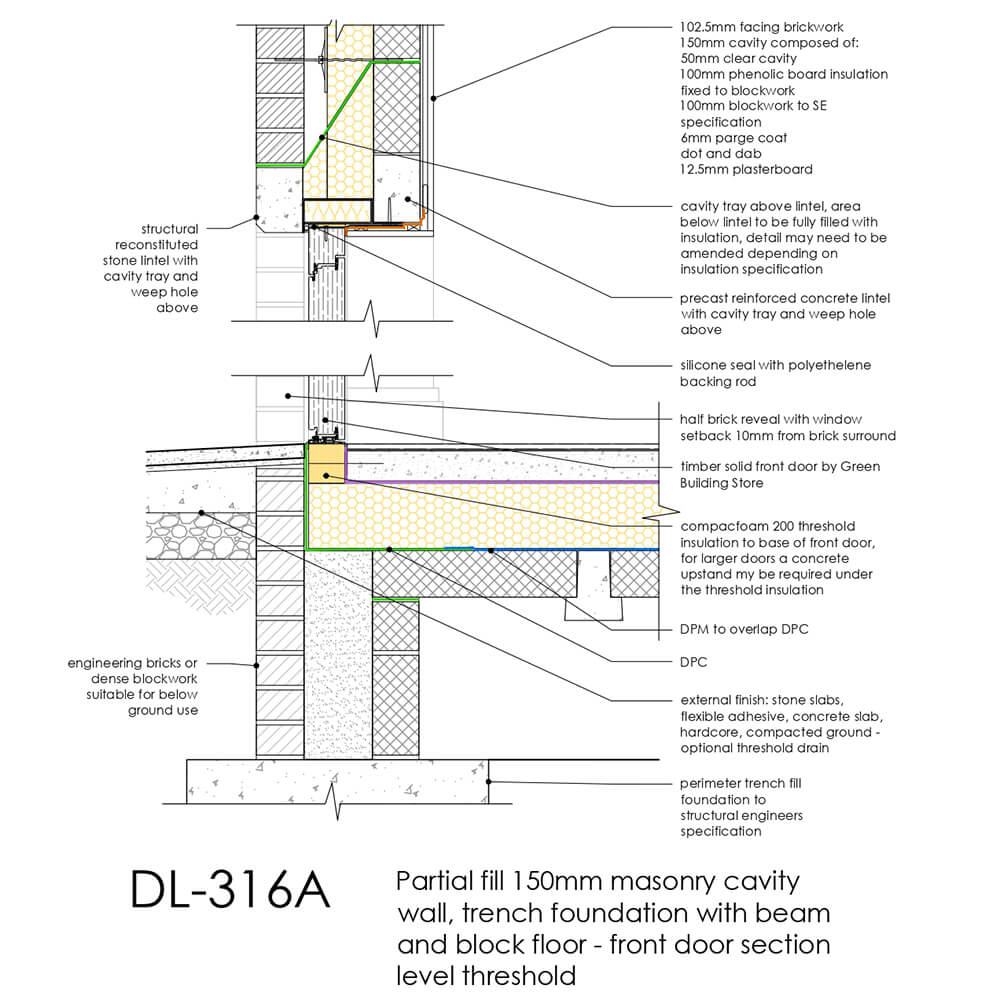
On the right, DL-316A shows the importance of a thermally broken threshold, here utilising a block of insulation directly under the door.
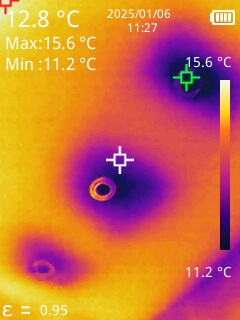
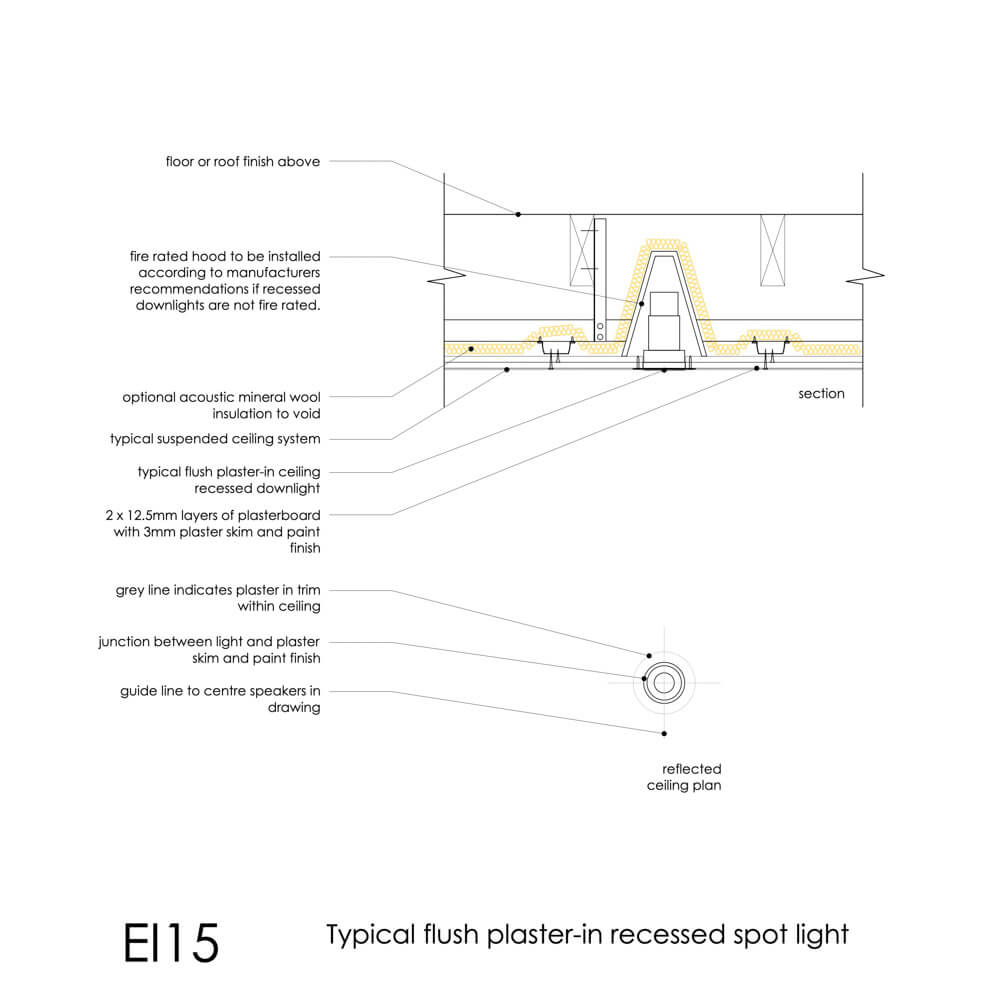
4. Recessed lights in a flat ceiling
On the left, insulation is often pulled away from light fitting due to increased fire risk, leaving large cold bridges.
On the right, EI15 shows how this can be managed with a proprietary loft lid so the insulation layer can be continuous.
5. Uninsulated flat roof
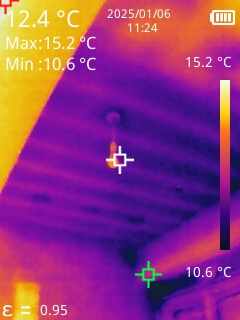
On the left, insulation is missing or has failed within this flat roof extension, requiring further intrusive investigation.
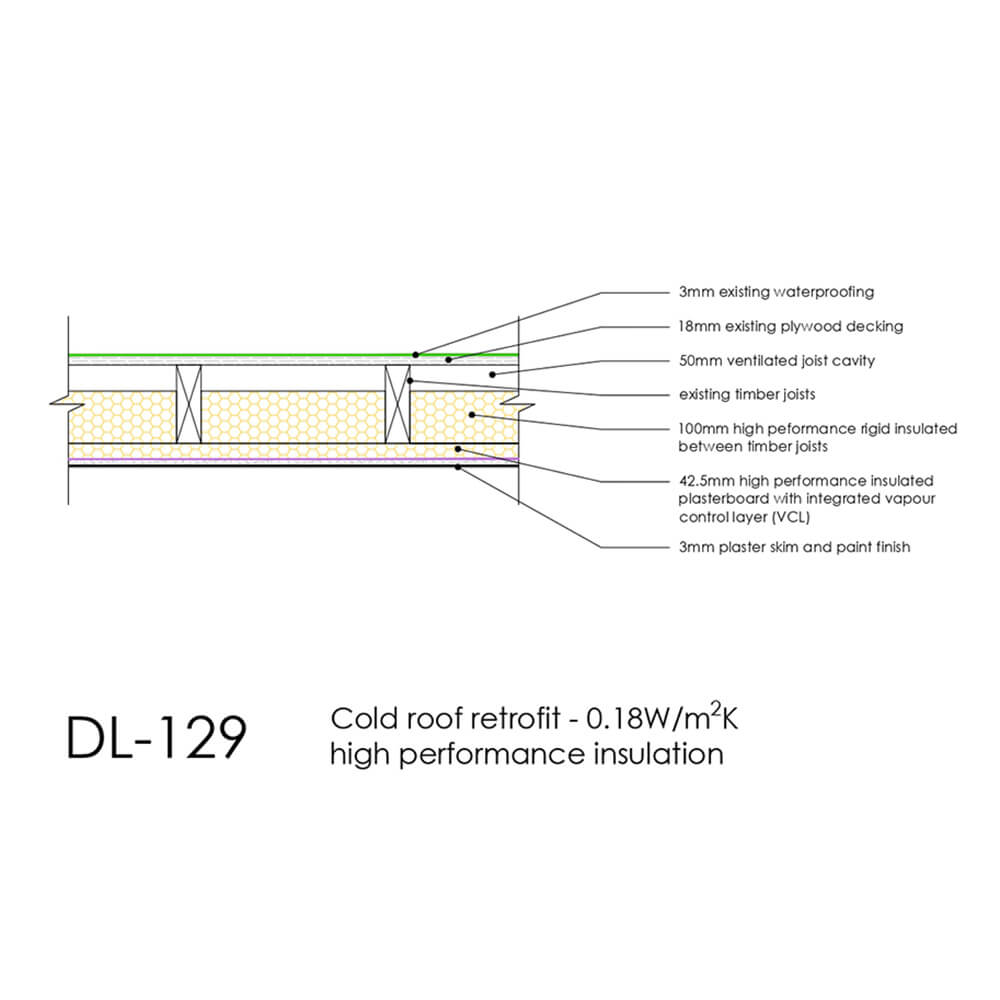
On the right, DL-129 shows a cold roof retrofit with insulation between the joists, across the inside and crucially, a ventilation path on the outer face below the waterproofing layer.
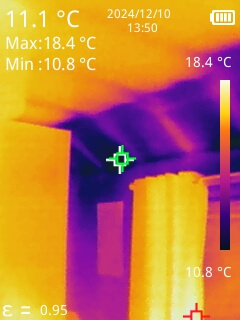
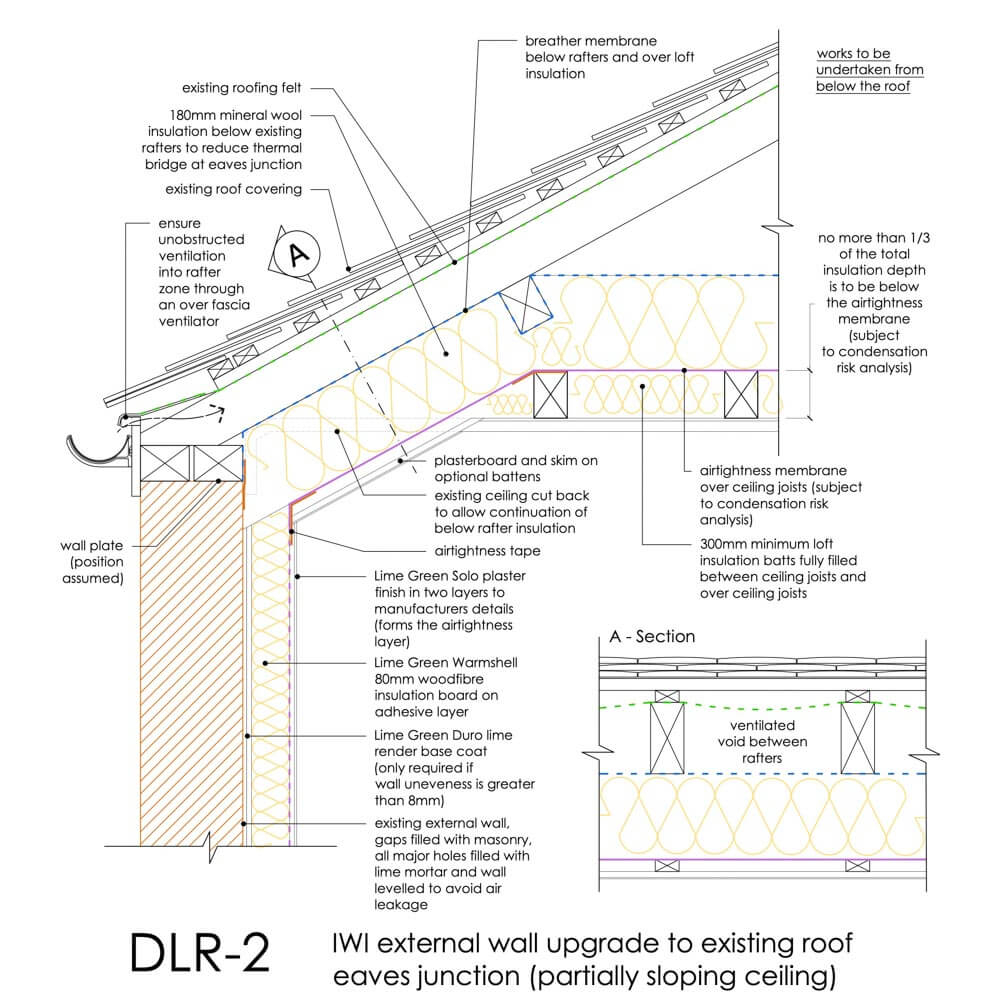
6. Uninsulated dropped eaves
On the left, insulation is missing at the dropped eaves or ‘skeiling’ which is a common area where condensation and mould can occur.
On the right, DLR-2 shows a well-insulated dropped eaves forming a continuous thermal line with IWI on the walls and traditional loft insulation across the ceiling.
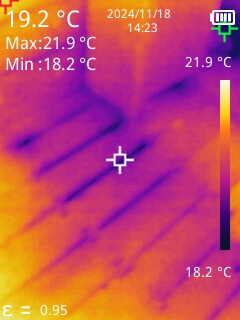
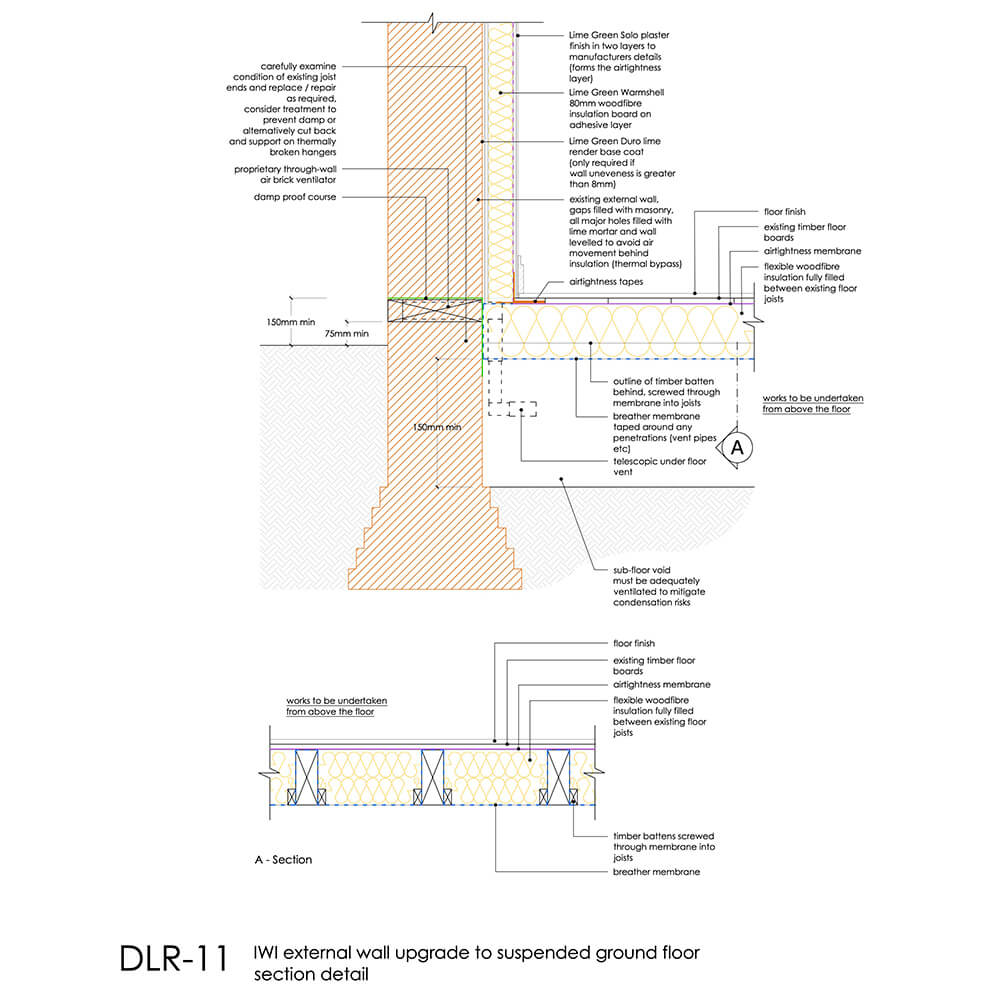
7. Draughts through a suspended timber floor
On the left, cold air draughts can be visualised as blue lines between the floorboards.
On the right, DLR-11 shows the best practice approach to insulating a suspended timber floor for both improved thermal performance and draught proofing, tightly packing soft insulation materials between the joists, protected by a VCL.
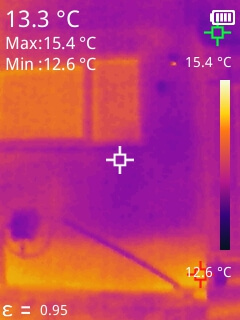
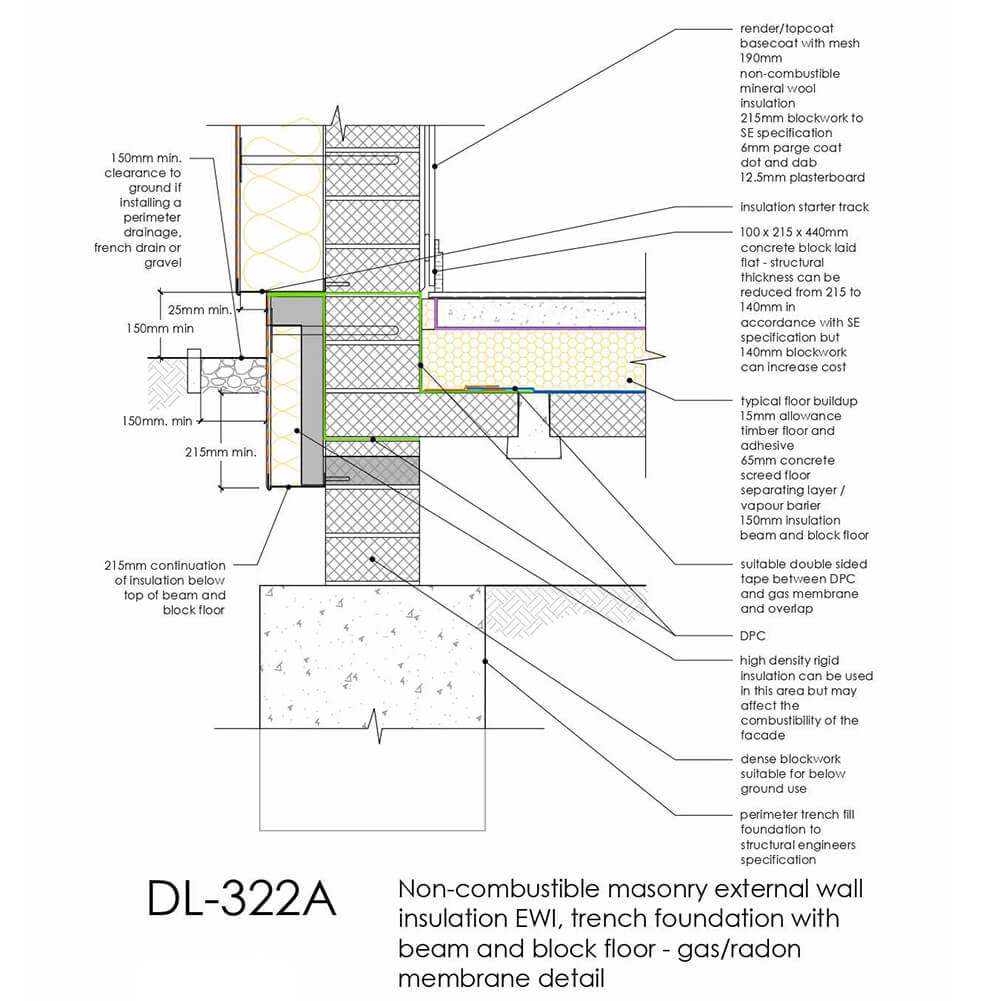
8. Heat through solid ground floors
On the left, an uninsulated solid floor is conducting heat downwards to the external wall edge, raised up above ground level, bypassing the cavity insulation.
On the right, DL-322A shows an insulated slab edge extending below ground level, suitable for both solid and suspended floors to protect this vulnerable edge from creating heat loss.
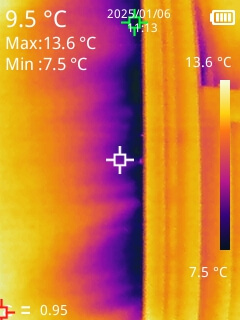
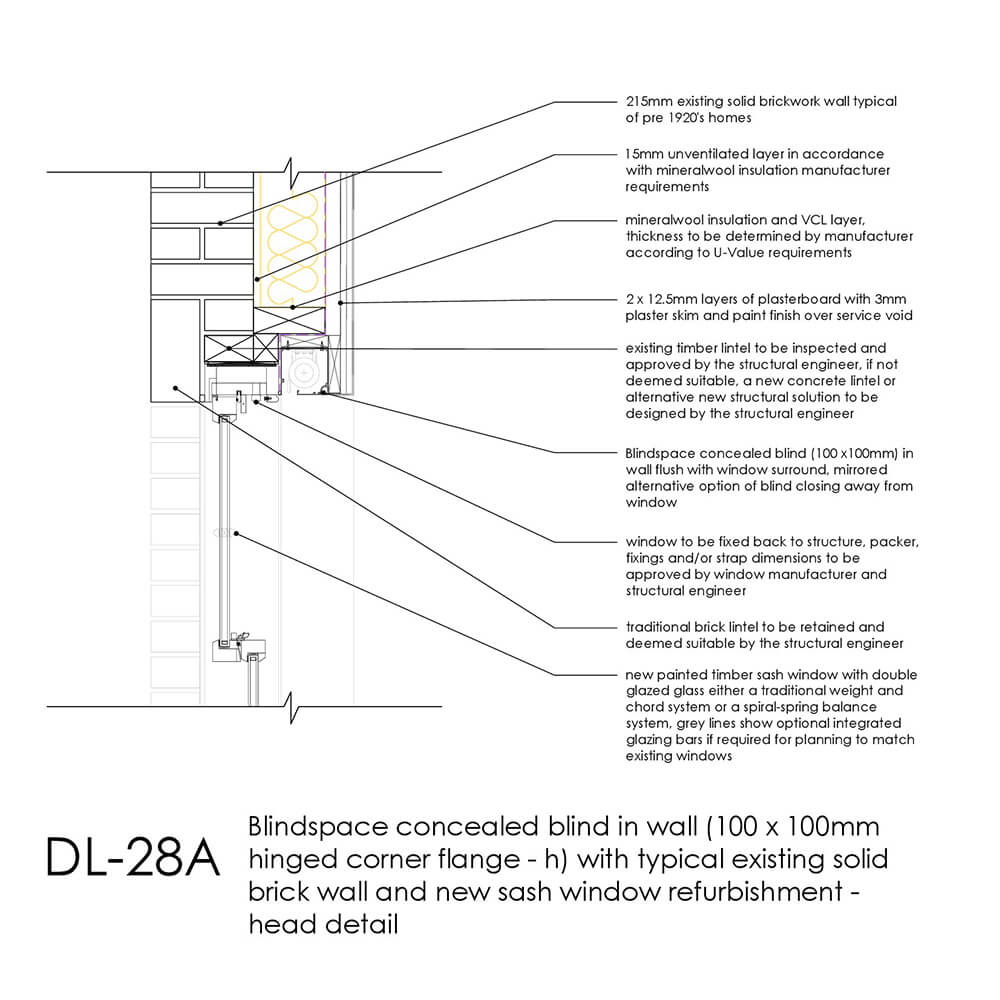
9. Air leakage around sash windows
On the left, cold air laps around the edge of a poorly installed window in a historic wall.
On the right, DL-28A shows a sash window installation, properly installed without gaps, here also incorporating a blind box at the head.
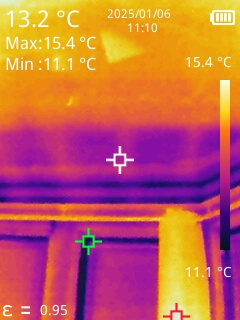
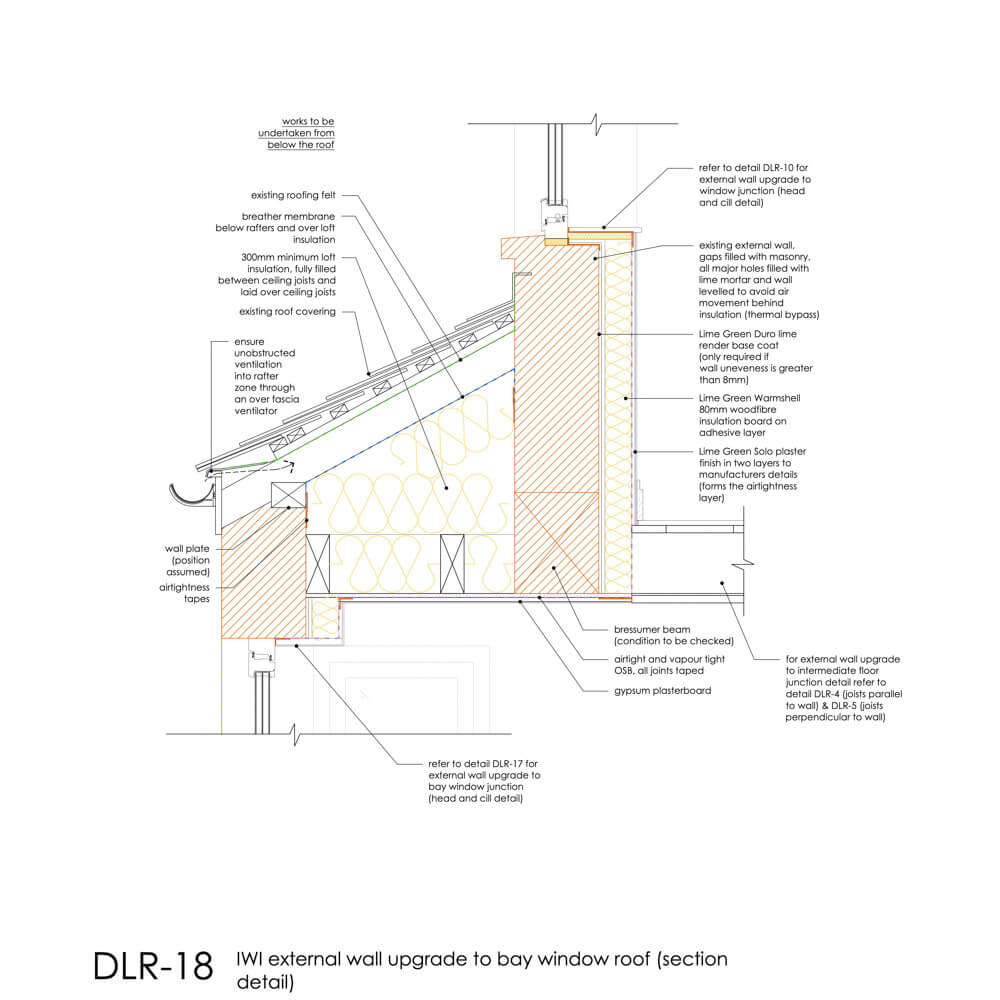
10. Bay window lid
On the left, in mid-century homes, bay windows often have poorly insulated roofs, causing discomfort in front rooms and master bedrooms.
On the right, DLR-18 shows how these ceiling voids can be well insulated alongside IWI to the existing solid external walls.
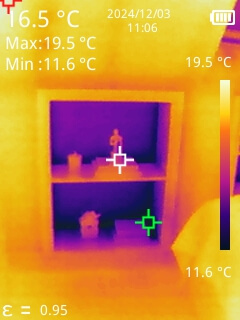
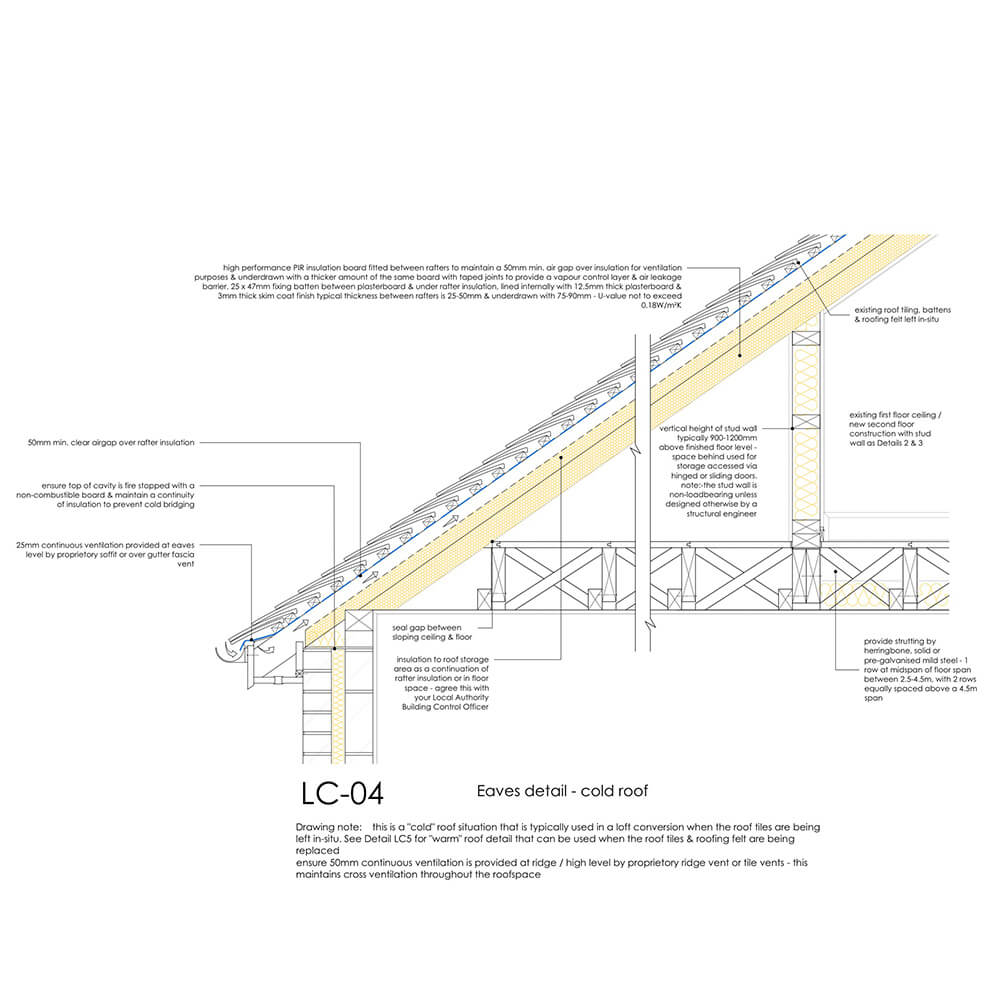
11. Loft conversion alcove
On the left, a storage alcove in a converted roof has no insulation thickness into the cold ventilated eaves, leaving a huge gap in the thermal envelope.
On the right, LC-04 shows how an upstand wall between a heated space and the cold eaves must be insulated along with any connecting hatches.
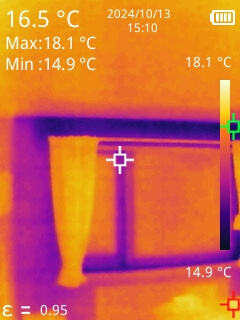
12. Conduction through dense lintels
On the left, a dense concrete lintel is visible as a blue block across the top of the window in a 1960s cavity wall.
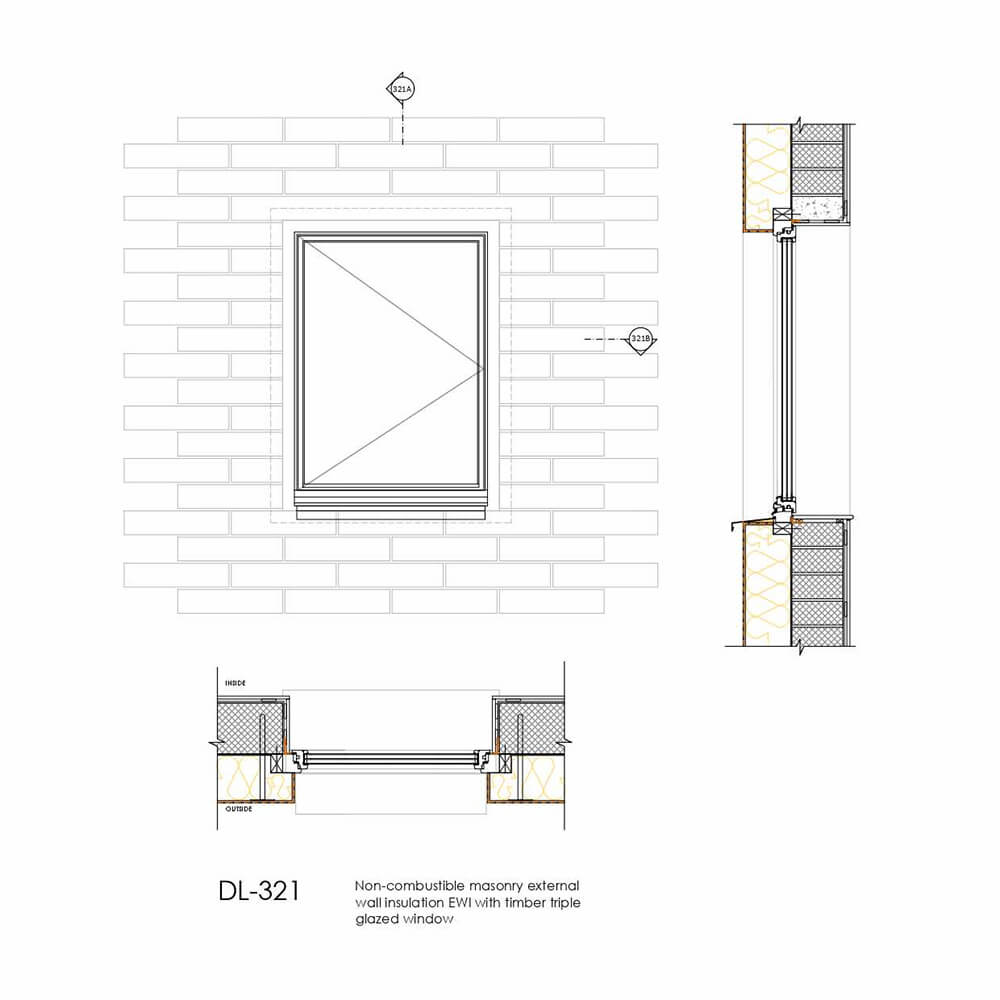
On the right, DL-321 shows how EWI can mask any poor original wall components. Here the windows are moved out into the insulation zone forming a continuous line outside the original masonry, wrapping the old lintel in the process.
Download the Guide
Download the Details
Check out the Detail Library for hundreds of details you can download to use in your own projects!
Related Reading

Author
Written by Alex Bell, Retrofit Architect, Retrofit Coordinator and Passivhaus Designer with 25 years’ experience of design and construction. Alex practises low energy, sustainable design using the Passivhaus principles, EnerPHit or the PAS 2035 Retrofit approach.